With the release of Quantum XL 2012, we introduced a Hypothesis AutoTest capability. This feature analyzes various statistics of your dataset and endeavors to perform the appropriate hypothesis test for Mean/Median and Variation. When analyzing two or more samples, AutoTest implements our flow chart for choosing the hypothesis test. While no automatic test is perfect, using AutoTest can significantly save you time in data analysis. Please read these notes on the limitations of AutoTest.
To demonstrate this feature, I will reuse the data from the article comparing the web page load times for two different hosting providers. If you are interested in my motivation, read the full back story or just read ahead if you are only interested in the math. The short version …. I am comparing the page load speed of my current host, Alentus, to another hosting company, HostMonster.
When comparing two or more datasets, you need only select the data and choose AutoTest from the Hypothesis Test menu item. You can optionally download this data in an Excel worksheet by clicking here.
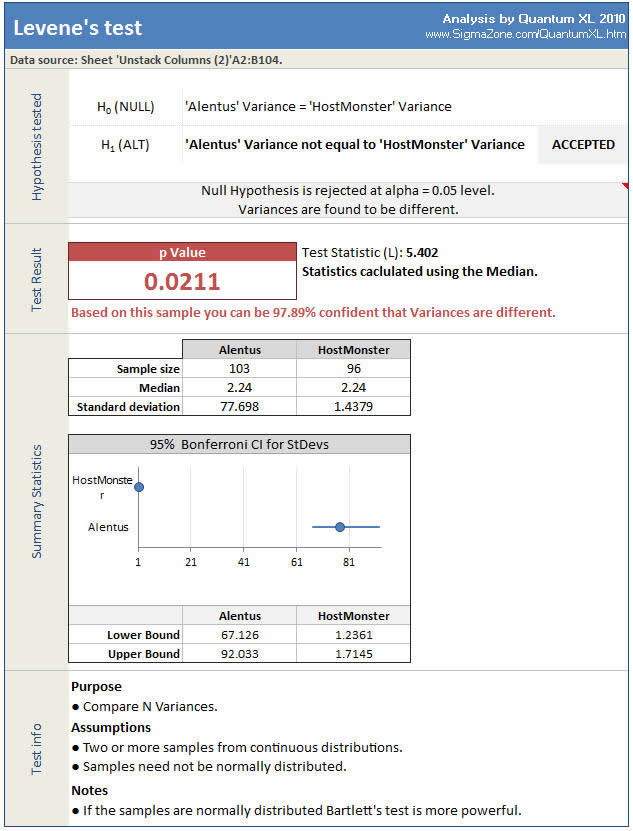
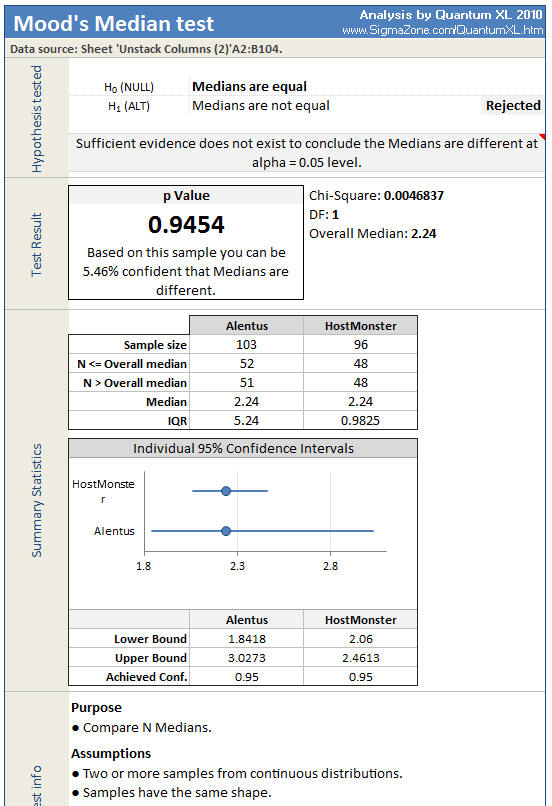
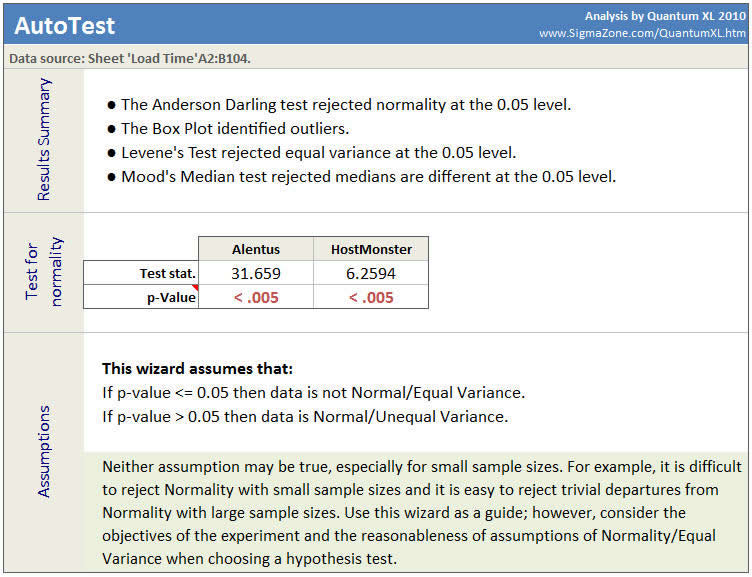
Quantum XL will output a summary of the results along with a detailed analysis. The summary is below. The key information is under the heading “Results Summary”. In this case, the AutoTest used the Anderson Darling test to reject normality. This is an important step as both the test for the Variance and the Mean/Median need to know if the data is normal. The next line identifies that outliers were identified using a Box Plot Analysis. Again, this information is important as it affects which hypothesis test to run. At this point, AutoTest ran Levene’s test for variation. Levene’s test was the correct test to run assuming non-normal data. Levene’s test rejected equal variance at the .05 (default) level, meaning AutoTest will not assume the data sets do not have equal variance. Finally, AutoTest ran Mood’s Median to compare the median of each dataset. Mood’s Median is the correct test to run if the data is not normal, has unequal variance, and has outliers. Mood’s Median failed to find a difference in the median at the .05 levels. The p=.05 level is the most common level for acceptance in Hypothesis Testing; however, if you would prefer Quantum XL provides the option to change this level in the options.
Quantum XL also provides the detailed analysis for both the Levene’s Test and Mood’s Median test. Their output is below.