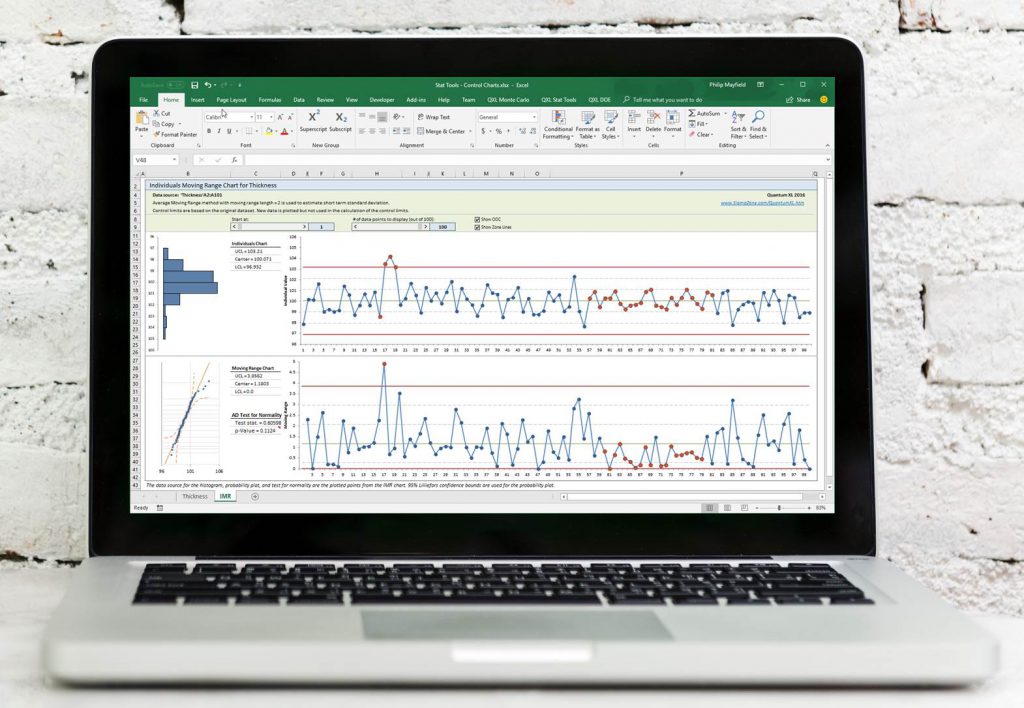
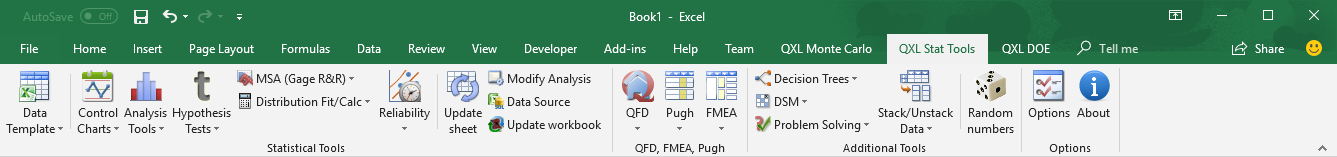
Control Charts, Capability Analysis (Cpk), Histograms, Pareto, Hypothesis Testing, Measurement System Analysis (MSA), Distribution Fitting, Reliability Modeling, Transformations, Decision Trees, Problem Solving Templates, QFD/Pugh/FMEA Templates, and much more.
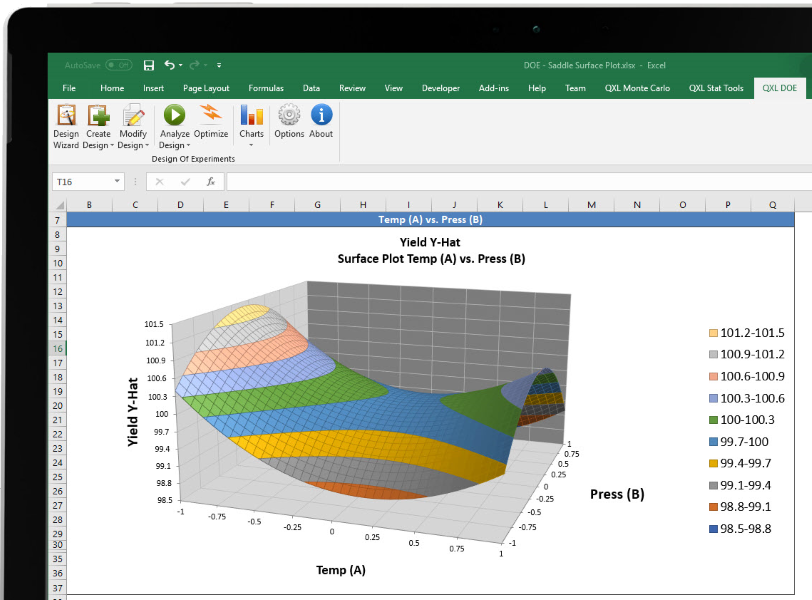
Design Of Experiments (DOE)
Design Wizards to help you select the best design for the problem
Support for Full/Fractional Factorial, Central Composite, Box-Behnken, Plackett-Burman, Custom, and D-Optimal Designs
Least squares and Logistic Regression Analysis
Automatic support for categorical predictor variables
Optimization, Surface, and Interaction Plot
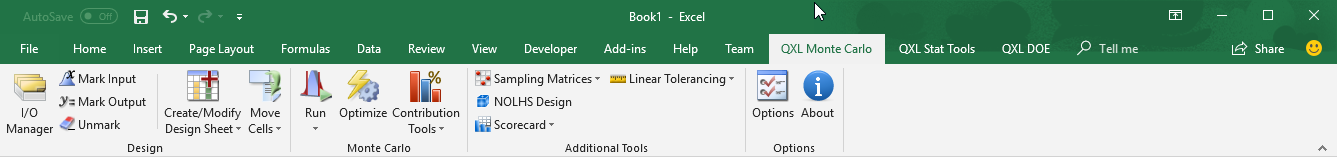
Monte Carlo Simulation
Insanely Fast Monte Carlo Simulations. In excess of One Million simulations per second for simple models.
Mersenne Twister Random Number Generation
Support for most continuous and discrete distributions, as well as defining a custom distribution from data.
Latitude, Surface, and Contour Plots
True Multi-Objective stochastic optimization and Percent Contribution plots
 Quantum XL