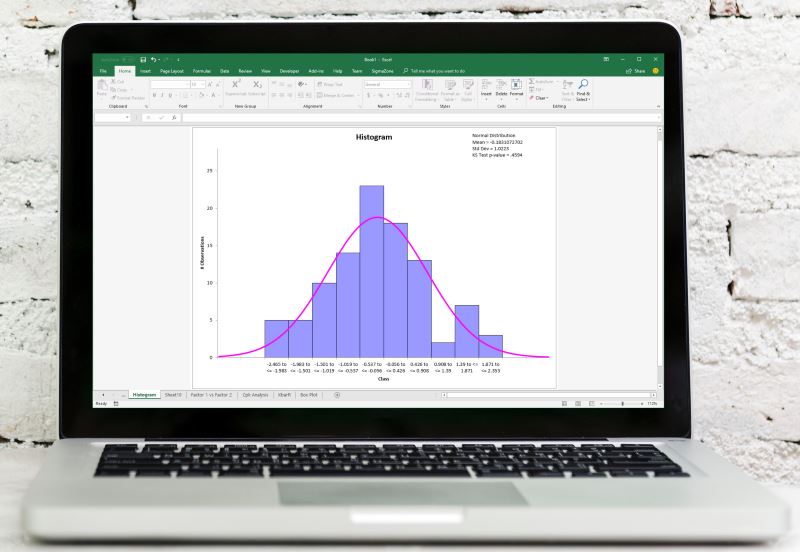
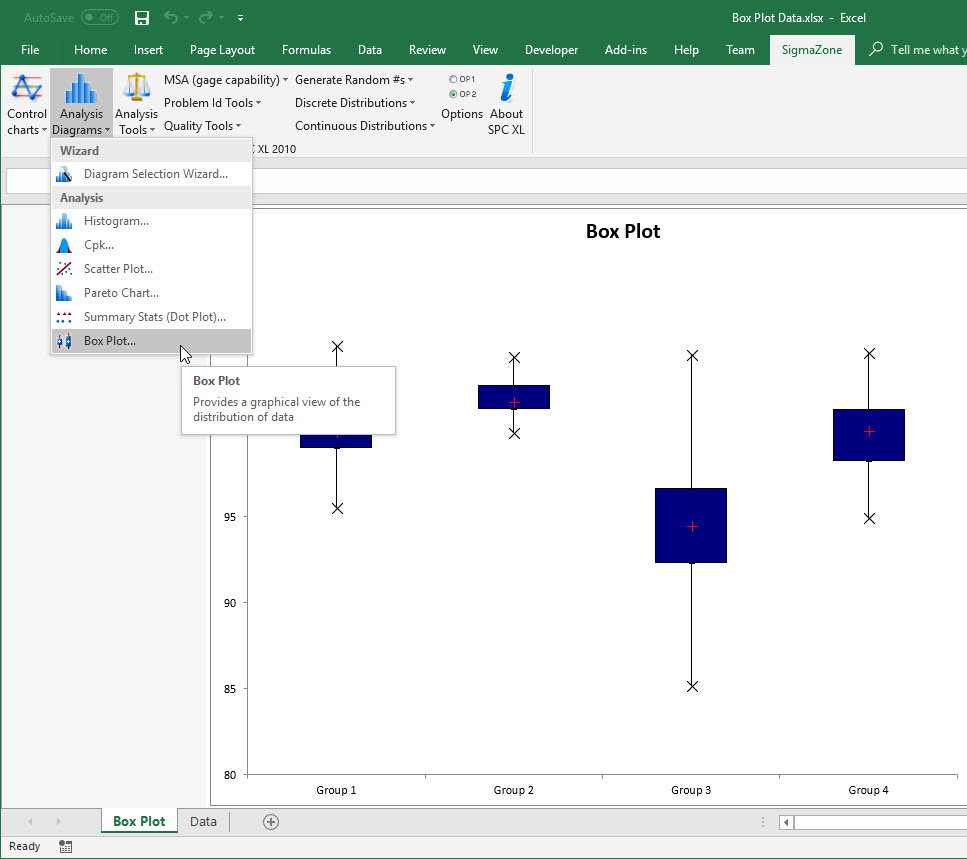
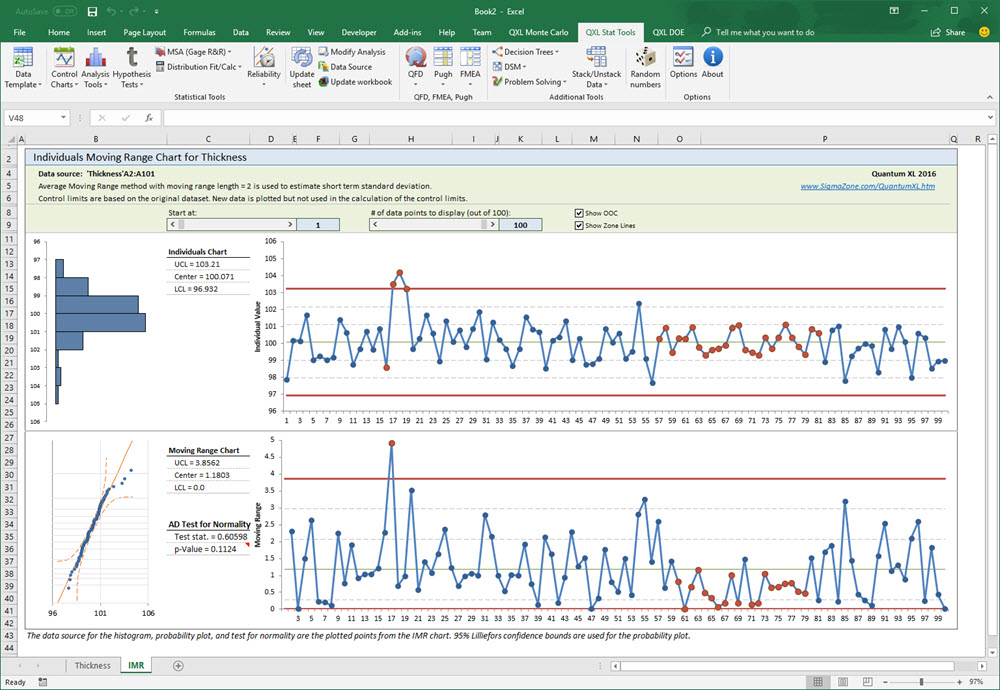
SPC XL integrates into Excel, streamlining your workflow and saving you time.
Control Charts
XbarR, XbarS, Individuals, n, p, u, and np Charts. Update charts after they've been created. Identify outliers and have them displayed without affecting the control limiits.
Measurement System Analysis (Gage R&R) for both Quantitative and Binomial Data, Cause and Effect Diagram, Main Effects Plots, Cusum, Product Capability, FMEA, and Distribution Calculators.
I have studied and applied several leading statistical software applications over the last 9 years. I have instructed statistics to hundreds of Black Belts. I always launch SPC XL first. It is the easiest statistical software to use, and has met 99 percent of my statistical needs. If ‘lean’ is about delivering the greatest customer value per dollar, SPC XL wins.
Thomas C. Stroup, Lockheed Martin Inc. P.E. Lean Six Sigma Black Belt